
The Power of Psychophysics

Panels with white background: 1877 drawings of the retina as the photoreceptors’ pigment is progressively bleached by light. Drawn by the German physiologist/histologist Franz Christian Boll (1849-1879) who discovered rhodopsin (visual purple), the molecule that initiates the visual response after capturing a photon. Panels with dark background: Modern photomicrographs of the retina before (bottom) and after (top) bleaching. See http://commons.wikimedia.org/wiki/File:Boll_retina_1877.JPG
In 1936, the esteemed Harvard Experimental Pyschologist S.S. Stevens wrote a paper with the provocative, rather arcane title “Psychology: The Propaedeutic Science“. This was published not in a psychology journal, but in Vol. 3 of Philosophy of Science. And appropriately so: the paper made the outrageous claim that, as implied by its title, Psychology was the foundational Science underlying all other Sciences, including biology, physics, chemistry, astrophysics…His thesis, pared down to its essential claim, was that all of Science, all hypotheses and theories were, ultimately, contructed upon a foundation of human observation. For example, astrophysics’ pedigree hails back to the numerical categorization of the brightness of stars by the Greek astonomer and mathematician, Hipparchus, around 150 B.C. He sorted 1000 stars into 6 brightness categories, or brightness magnitudes.
(N.B. A key ingredient underlying hypothesis formulation that Stevens likely did not elaborate is arguably a signature property of human consciousness: what C.W. Tyler calls “Interrogacy” in his 2020 publication “Ten Testable Properties of Consciousness”, the ability to formulate questions. Tyler, Frontiers in Psychology, 11: 2020. doi: 10.3389/fpsyg.2020.01144).
<><><>
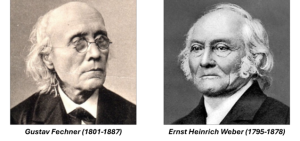
Human observation has always been the basis upon which humans formed hypotheses about causal relationships governing the phenomena we observed. However, it was formalized into a foundational Science by Gustav Fechner (1801-1887) and by Ernst Weber (1795-1878): the Science of Psychophysics. And it is, in essence, this Science that Stevens was trumpeting.

<><><>
During my tenure as a Visiting Professor at the Universidade de São Paulo in Brasil, I did psychophysical research on human Spatiotemoral processing as well as research on visual development of infants and spatial vision in adults using brainwave-based measures: specifically swept-parameter visual evoked potentials (sVEPs) measured from the scalp (using EEG electrodes). In the case of the infants, the sVEPs permitted us to efficiently estimate visual acuity or contrast sensitivity at the level of primary visual cortex.
Over the course of many discussions about the lab’s research, and in lectures by students, faculty and visiting scholars, I noticed that there was a tendency to refer to data obtained from electrophysiological measurments as “objective” data, as opposed to “subjective” data obtained from psychophysical measurements. Such a characterization rumpled my “psychophysical feathers”, especially after reading Stevens’ paper, and after having done more than 30 years of psychophysical research. I felt that I needed to counter the narrative that psychophysical data were “merely” “subjective”.
Thus, I developed a Powerpoint presentation on The Power of Pyschophysics. The presentation highlights a long list of major advances and discoveries in sensory-perceptual neuroscience. In each case, the scientific-intellectual advance was first ignited by either psychophysical measures or by dint of logical/cognitive reasoning or both. Physiological (anatomical or electrophysiologoical) confirmation of these major advances only occurred years or even decades (or centuries) later.
Trichomatic Theory of Color Vision Proposed 160 Years Before Physiological Confirmation
For example, the trichomatic theory of color vision was first proposed in a basic form by George Palmer in 1777, and then refined and elaborated by Thomas Young (1773-1829): physician, physicist, polymath, polyglot (12 languages), established a wave theory of light, deciphered Egyptian hieroglyphs (The Rosetta Stone). It wasn’t until 1964 that Marks and colleagues measured three distinct spectral sensitivities (having peak sensitivities at 445, 535 and 570 nm) from individual primate cones: more than 160 years after Young “deduced” their existence based solely on observation and logic (Marks, Dobelle and MacNichol. “Visual Pigments of Single Primate Cones.” Science 143.3611, 1964. pp 1181-182.).
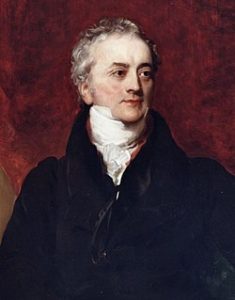
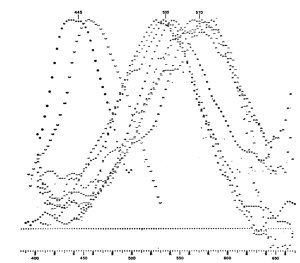
LEFT: Thomas Young portrait by Henry Perronet Briggs, 1822. RIGHT: Fig. 2 from Marks et al. (1964) showing the action spectra for 3 cell types in the primate retina with maximum responses at 445 nm, 535 nm and 570 nm.
Temporal Frequency Channels In The Auditory System: Critical Bands
In two papers in 1933 and 1940, Harvey Fletcher & Wilden Munson measured psychophysically temporal-frequency tuned channels in the human auditory system while working in Bell Labs. Their approach was both creative and ground-breaking.
In the absence of masking, auditory thresholds (Ta) vs Temporal Frequency (TF) plotted on log-log axes follow a broad inverted U-shaped function, with a minimum Ta around 2500 Hz. Fletcher showed in his 1940 paper that if you measure Ta vs TF in the presence of a narrow-band masker, instead of the entire threshold vs TF curve being elevated, the masked auditory thresholds were only elevated over a restricted range of masker TFs above and below the test TF. Detailed measures of masking at many TFs reveal that the auditory system has many such tuned channels, so-called Critical Bands. Here are four from a later study.
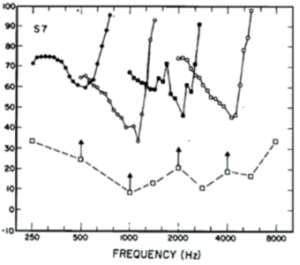
This graph shows four critical bands measured in one subject from Carney & Nelson (Fig. 1 in J. Acoust. Soc. Am. 73: 268-278, 1983). Vertical arrows mark the frequencies and SPLs of the test probe tones. The ordinate is MASKER LEVEL in dB SPL used to obtain each psychophysical threshold measured at many TFs around the probe TF (vertical arrows). The masked thresholds measured for each masking TF are plotted as open or filled circles.
Maskers affect the psychophysical threshold for detection of the probe tone over a restricted range of TFs above and below the frequency of the probe tone. The least amount of masker SPL needed to mask detection occurred at the frequency of the probe tone (arrows). Thus, these inverted V-shaped functions map out the TF range of four critical bands.
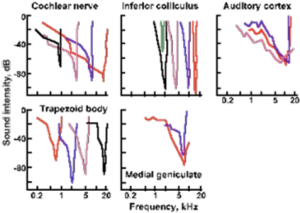
Physiological counterparts of psychophysical critical bands were first measured two decades later in cat auditory neurons in inferior colliculus and medial geniculate nucleus and in auditory cortex (Katsuki Y: Neural mechanisms of auditory sensation in cats. In Rosenblith WA [ed]: Sensory Communication. Cambridge MA, MIT Press, 1961). See their figure below.
<><><>
It took almost 40 years for Visual Neuroscientists to demonstrate an analog of auditory critical bands in visual perception: Spatial-Frequency Tuned Channels.
Spatial-Frequency Tuned Channels In The Visual System
Though delayed compared with analogous discoveries in audition, SF-selective channels were measured psychophysically and physiologically in the same year. In a seminal psychophysical paper in 1969, Colin Blakemore and Fergus Campbell proposed that the visual system contained spatial frequency channels for processing visual stimuli of different sizes (analogous to the auditory system's critical bands). They performed a very clever experiment: if there were spatial channels in the visual processing pathway, then if you adapted the system at a specific spatial frequency (SF), say 7 cycles/deg, then the psychophysical Contrast Sensitivity function (CSF) should show a post-adaptation decrease in sensitivity only over a restricted range of SFs near 7 cycles/deg. If, on the other hand, detection were mediated by only one channel, adapting at 7 cycles/deg should desensitize the entire CSF, i.e. at all SFs. The results were unequivocal: adaptation at 7 cycles/deg, only decreased sensitivity at and near 7 cycles/deg. The paper was published in the prestigious Journal of Physiology (JP).
In that same issue of JP, Campbell, Cooper & Enroth-Cugell published a study demonstrating spatial selectivity of cells in the visual cortex of cat. A year later, Campbell & Maffei, using visual evoked potentials, demonstrated SF-selective and orientation-selective cells in human visual cortex. Shortly thereafter, Maffei & Fiorentini measured multiple spatial channels tuned to different spatial frequencies in cortical cells in cats (Vision Research, 13(7), 1255–1267, 1973). A decade pater, spatial-frequency-tuned cells in primate visual cortex were measured by DeValois, Albrecht & Thorell in 1982 (Vision Res. 22, 545-559. 1982).
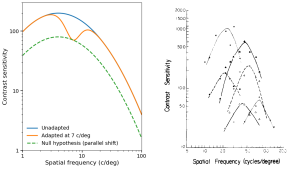
LEFT: Redrawing of Text-fig. 6 from Blakemore & Campbell (J. Physiol. 207, p. 237, 1969). Contrast sensitivity (CS) vs Spatial Frequency for author F.W. Campbell before adapting at 7 c/deg (dark blue curve) and after adaptation (orange curve). The dashed green curve shows what would be expected if the visual system did not have multiple spatial frequency channels tuned to different spatial frequencies (i.e., only one channel). The data clearly showed that adaptation at 7 c/deg depressed sensitivity for a restricted range of spatial frequencies above and belore the adapting frequency. These data are consistent with a SF channel with relatively narrow bandwidth as opposed to the null hypothesis of a single spatial channel. RIGHT: Fig. 4 from DeValois et al. (1982). Six SF-tuned cells recorded from primate visual cortex. Symbols mark the reciprocal of the stimulus contrast (i.e., CS) at each spatial frequncy required to elicit a constant response criterion.
Many Other Examples
In my presentation I give many other examples of seminal scientific advances that began based on psychophysical observation (plus reasoning) prior to any "objective" electrical or chemical or anatomical confirmation.