
Spatiotemporal Processing
Collaborations with Christopher W. Tyler, B.A., M.Sc., Ph.D., D.Sc., F.R.G.S., Senior Scientist at Smith-Kettlewell Eye Research Institute, San Francisco, CA; USA, Adjunct Professor, UC San Francisco; Professor, Division of Optometry and Vision Sciences, City University, London, UK
Christopher Tyler and I collaborated on several studies examining the temporal limits of vision: e.g., what is the fastest light can flicker and still be seen as flickering and not a steady light. The fastest temporal frequency (flicker rate) detectable is called the Critical Flicker Frequency (CFF). Dating back many decades, scientists found that CFF increases very linearly with the logarithm of the mean light intensity of the flicker stimulus. This linear relation is called the “Ferry-Porter Law” (F-P Law), named after two scientists who studied the phenomenon at the end of the 19th century and beginning of the 20th.
My publications with Tyler on the topic showed: (1) when rods are not contributing to peceptual detection, cone-mediated CFFs increase according the the F-P Law (linearly) over a wide range of mean light levels, (2) the slope of the F-P line is about twice as steep when detecting flicker in the periphery compared with central foveal F-P lines; (3) the CFFs measured when detected via stimuli applied to peripheral retina are much faster, and, for very bright stimuli, reach approximately 100 Hz. In the fovea, the maximum CFF at any brightness is about 50-55 Hz.; (4) Extrapolaation of the CFF lines down to the x-axis (luminance), i.e. to zero Hz on the y-axis, provides an excellent estimate of absolute detection threshold for that stimulus; (5) the slopes of the F-P lines systematically vary depending on the wavelenth of the light being used: we found that F-P lines were significatly steeper when green light was used vs when red light was used. The implications of this wavelength dependence is still controversial, although in our paper we proposed that the neural pathways activated by green light were inherently faster than those activated by red light even though there is no evidence that “red-sensitive cones”and “green-sensitive cones” have inherently different response kinetics.
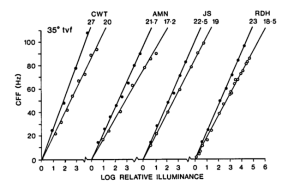
Ferry-Porter (F-P) data from Hamer & Tyler (1992). Critical flicker frequency (CFF) vs Log Retinal Illuminance measured for 4 subjects viewing either Red or Green flickering LEDs presented at 35 deg in the temporal visual field. All the data adhere closely to the F-P lines over 4-5 log units. The steeper slopes show CFF thresholds measured with green light implying that the visual system was faster when green light was used. The standard deviation bars were smaller than the data points. Also note that CFF measured at high illuminance approaches or exceeds 100 Hz in peripheral retina. In the fovea that “speed-limit” is about 50 Hz (compare figure above with analogous data obtained from the fovea: see Figs. 2 & 3 in this PDF and also Figs. 5-7, in this PDF2).
Our data also showed unequivocally that changes in stimulus area caused parallel shifts the F-P lines along the intensity axis unless the change in stimulus size was such that the larger stimulus activated patches of retina with inherently different temporal properties than those activated by the smaller stimulus. For example, a stimulus that activated some foveal cells (slower) plus some extra-foveal cells (faster) would not necessarily yield F-P data that matched data obtained entirely from peripheral retina. The parallel shift with change in stimulus size followed a prediction based on complete spatial summation.
Finally, our data confirmed that when measuring F-P functions with the proper stimulus conditions, the visual elements involved in detcting the flicker were linear: hence, over a reasonable range of intensities, addition of a steady background to selectively desensitize (chromatic adaptation) one class of cones (thus forcing detection to be mediated by anoher class of cones) was ineffective over a fairly wide range of adapting intensities. This meant that classic “chromatic adaptation” methods could not be used to “isolate” a specific cone class.