
Visual Development Studies
Department of Psychology, University of Washington, Seattle, WA, USA
(With Davida Y. Teller, Marilyn E. Schneck, Kenneth R. Alexander)
Between 1978 and 1982, I was a Postdoctoral Fellow in the Psychology Department at the University of Washington. My Postdoctoral mentor, Davida Y. Teller, was a pioneer scientist in the field of Human Visual Development. Davida and colleagues developed the first objective method for measuring sensory capacity of infants, the Forced-Choice Preferential Looking (FPL) technique starting back in the 1970s.
I discussed the contribution of and innovative aspects of Teller’s FPL method in a 2016 paper (The visual world of infants. American Scientist 104: 96-101, 2016). The technique took advantage of infants’ reflexive (innate) looking behavior: their visual attention is preferentially drawn to look at patterns, or colors, or moving stimuli over a homogeneous, stationary unpatterned stimulus. And so Teller and colleagues (including me) used infants’ looking behavior to reliably estimate various aspects of their visual capacities: e.g, their visual acuity, that is, the finest detail they could see at each age (reviewed in Hamer, 2016); their ability to see colors at various postnatal ages (Hamer, Alexander & Teller, Vision Res.; 22(5): 575-577, 1982). https://doi.org/10.1016/0042-6989(82)90116-x , 1982); their absolute sensitivity to extremely low light levels (scotopic sensitivity) (Schneck et al., Vision Res. 24(12):1753-63, 1984; Hamer & Schneck, Invest Ophthalmol Vis Sci.; 25(4): 381-388, 1984).
In a 1982 study of development of color vision, my colleagues and I (Hamer, Alexander & Teller, 1982) showed that by 4 weeks of age, about half of the infants had color vision (reliable “Rayleigh Discriminations“, i.e., discriminations along the Rayliegh axis, such as discrimination of Red or Green stimuli against a pure sodium-yellow surround at 589 nm). By 3 months of age, nearly 100% of the infants demonstrated robust Rayleigh Discriminations. Demonstration of Rayleigh discrimination in most 2- and 3-month olds meant that the infants had devloped the neural circuitry in the retina and visual cortex needed to extract a chromatic signal from the output of the Red (long-wavelength-sensitive) and Green (middle-wavelength-sensitive) cones. A later study out of the Teller lab (Varner et al., 1985) confimed that 1- and 2-month olds also had access to Blue (short-wavelength-sensisitive) cone signals that permitted them to behaviorally show that they could make tritan discriminations: i.e., these young infants were trichromats. Other research in the Teller lab indicated that these young infants generally required more saturated chromatic stimuli to reliably detect them than adults.
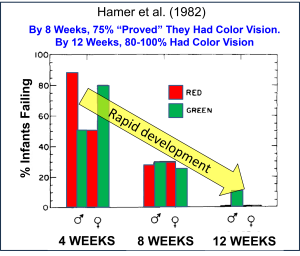 The bars show the % of infants failing to show color vision
<><><>
Smith-Kettlewell Eye Research Institute, SF, CA. USA: 1979-1995
(with Anthony M. Norcia, Christopher W. Tyler, Arthur Jampolsky, Susan H, Day, Charlene Hsu-Winges, Wolfgang Wesemann)
Over a 16-year period at Smith-Kettlewell, my collaborators and I studied development of a number of different aspects of visual function in human infants and toddlers. However, our method of measuring visual responses was not behavioral, as in FPL. We used a brainwave-based method developed by Norcia and Tyler, and later with me as a collaborator, that permitted us to obtain estimates of visual threshold in the various tasks as much as 30 times more efficiently than the FPL technique. The technique was the Swept-Parameter Visual Evoked Potential (SweepVEP, or sVEP; Norcia & Tyler, 1985; Hamer, Norcia & Tyler, 1989; Norcia, Tyler & Hamer, 1990). In the measurement of visual acuity (VA), for example, sVEP was recorded over a 10-sec stimulus period during which a phase-reversing high-contrast achromatic grating was “swept” in spatial frequency (SF) from low to high. The reversal rate was modest (in the range of 5-10 Hz), and the sVEP was analyzed using Discrete Fourier Transform (DFT). For the measurement of infant’s visual acuity, the SF range of the sweep was empirically adjusted to span the estimated acuity cutoff foir that age. In general, sVEP amplitude decreases linearly with SF. A cortical acuity is estimated by fitting a line to the sVEP and extrapolating along the descending waveform to the spatial frequency at which the sVEP amplitude equals zero microvolts.
This approach was used to measure visual acuity, contrast sensitivity at many spatial frequencies, oscillatory motion thresholds, vernier thresholds, developmental motion asymmetries, and so on.
Visual Functions Studied
(1) Development of Visual Acuity (VA): VA refers to the smallest objects (or letters) that a person can see when they presented at very high contrast (black-and-white) as in an adult eyechart exam. Using the sVEP method, we could measure an infant’s acuity in 10 seconds although we always measured the acuity 5 or more times to make sure the result was reliable. Using this very efficient method permitted us to map the development of VA in groups of infants from near birth to 1 or 2 years of age. We found that sVEP acuity developed rapidly and regularly over the first 8 months of life and then more slowly to adult levels over the subsequent 2 to 3 years (see our data in graph below).
(1) Development of Visual Acuity (VA): VA refers to the smallest objects (or letters) that a person can see when they presented at very high contrast (black-and-white) as in an adult eyechart exam. Using the sVEP method, we could measure an infant’s acuity in 10 seconds although we always measured the acuity 5 or more times to make sure the result was reliable. Using this very efficient method permitted us to map the development of VA in groups of infants from near birth to 1 or 2 years of age. We found that sVEP acuity developed rapidly and regularly over the first 8 months of life and then more slowly to adult levels over the subsequent 2 to 3 years (see our data in graph below).
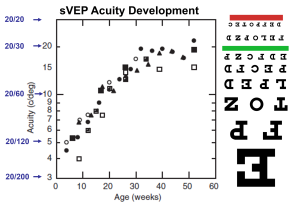 Graph showing the development of Visual Grating Acuity measured using the sweepVEP (from A.M. Norcia. 2003. Development of Spatial Selectivity and Response Timing in Humans. In The Visual Neurosciences, Edited by Leo M. Chalupa and John S. Werner, MIT Press, Boston, MA, USA. ISBN-10: 0-262-03308-9; ISBN-13: 978-0-262-03308-4).For reference an inverted standard EyeChart is placed lined up along the vertical acuity axis with the equivalent EyeChart Acuity values shown to the left of the vertical axis of the graph.
(2) Development of Contrast Sensitivity (CS): CS refers to the lowest contrast that a visual pattern can have and still be seen. Here are examples of alternating dark-and-light bars shown at various contrasts. The 4 gratings shown below were originally designed to have contrasts of approximately 10%, 20%, 40% and 80%, from left to right.
 Four sinewave gratings of increasing contrast: approxiamately 10, 20, 40, 80%, left to right
Note that the lowest contrast you can see depends on the size of the pattern: for very small (high-spatial-frequency) patterns, we need a lot of contrast to perceive them.
We found, using the sVEP method, that when large patterns (low spatial frequencies) were presented to the infants, based on their sVEP responses, by 10 weeks of age their brains were responding reliably to patterns with very low contrast, as low as 0.5%. NOTE: 0.5% contrast would correspond to a grating pattern in the above image with 20 times lower contrast than the grating on the left (10% ). Adults tested with the same sVEP equipment were only about two times more sensitive than 10-week-old infants viewing very-low-spatial-frequency gratings (Norcia, Tyler & Hamer, Vision Res.; 30(10): 1475-86, 1990).
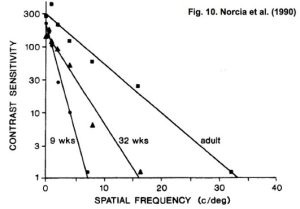
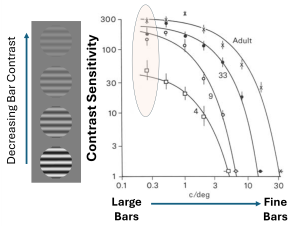
LEFT: Fig. 10 from Norcia et al. (1990) showing Contrast Sensitivity vs Spatial Frequency (SF) on a semi-log axis measured with the sVEP for a group of 9-week-olds, 32-week-olds and adults. Note that for low SFs, the cortical CS for both groups of infants, even the 9-week-olds, were within a factor of 2 of the adults CS. RIGHT: Fig. 13.3 from Norcia (2004, Chapter 13 in “The Visual Neurosciences”, Chalupa & Werner Eds., MIT Press, Cambridge, MA USA). This graph shows the data from the 1990 paper along with data from a group of 4-week-olds, all plotted now on log-log axes. Note that at low SFs, the 9-week-olds’ CS is approximately 5 to 6 times higher than the 4-week-olds’, revealing a relatively large and sudden increase in CS over this 5-week period of development.
(3) Development of Motion Sensitivity: We don’t live in a static environment. Our visual system evolved to have exquisite sensitivity to motion of objects. Using the sVEP method, we studied development of motion sensitivity, measuring the smallest motion of a visual pattern that an infant can detect across age groups (Hamer & Norcia, Vis. Res. 34, 2387-2402. 1994 https://doi.org/10.1016/0042-6989(94)90283-6). Infants’ sensitivity to moving patterns developed more slowly than their acuity or contrast sensitivity.
(4) Developmental Motion Asymmetry (DMA): Young infants have a peculiar asymmetry in their motion perception that only reveals itself when we test one eye at a time. When viewing a vertical bar-grating pattern that is drifting leftward, a young infant can track the grating readily when using the right eye: the eye follows the moving pattern until the eye cannot go any further, and then swiftly recovers. This repetitive eye-movement pattern is called optokinetic nystagmus (OKN). [watch someone’s eyes on the NY subway as you pass by a sequence of vertical supports].
That same young infant shows little or no response if the grating is now moved smoothly rightward when viewed with the right eye. In normal development, infants grow out of this asymmetry so that drifting motion of a repetitive pattern will evoke OKN in response to either direction of motion: the same as in adults. Hence the asymmetric eye-movement pattern in infants is called the Developmental Motion Asymmetry (DMA). We showed that a cortical counterpart to this asymmetry occurs in young infants’ brain responses, i.e., when tested monocularly, their sVEP responses to vertical gratings oscillating left and right at, say, 6 Hz are strong at 6 Hz (F1, the 1st harmonic) but not at 12 Hz (F2; Jampolsky et al., J. Ped. Ophthalmol. Strab. 31, 6-17. https://doi.org/10.3928/0191-3913-19940101-04 ,1994; Hamer & Norcia, Psychology & Neuroscience 2: 163-177, 2009). Moreover, the phase of this response is 180 deg out of phase compared to the corresponding monocular responses measured when the other eye views the stimulus. This pattern is consistent with the left- and right-eye monocular motion-evoked VEPs being driven by opposite directions of motion, analogous to observed asymmetries in eye movement patterns (monocular optokinetic nystagmus, OKN).
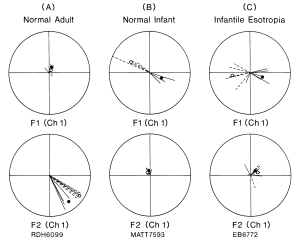
“Fig. 1. Polar plots of evoked potential amplitude and phase for a normal adult observer (A), a normal 16-week-old infant (B) and an adult with a history of infantile esotropia (C). Each vector is the result of a 10-sec trial. The length of each vector corresponds to the amplitude of the VEP, and the anglr around the circle corresponds to the phase of the response relative to the motion of the stimulus. Solid lines plot the response from the RE; dashed lines represent the LE. Filled and open symbols plot the vector average of the RE and LE responses, respectively. The upper plot in each panel shows the first harmonic responses (Fl), and the lower plot shows the second harmonic responses (F2). The response of the normal adult is dominated by the second harmonic of the stimulus frequency (F2). There is almost no response at F1. Both the normal infant and the esotropic adult patient show substantial first harmonic (F1) responses that are approximately 180° out of phase in the two eyes.” (from Norcia et al, 1991).
For the normal adult (left pair of polar plots), there was no response at the stimulus frequency (F1). The responses at the second harmonic (F2) were robust and the responses from the left and right eyes (dashed and solid phase lines, respectively) all had approximately the same phase (all in the lower right quadrant of the polar plot). Strikingly different from the adult data, the normal 16-week-old infant’s data (center plots) had no responses at F2, but only responses to the 1st harmonic with the two monocular responses 180 deg out of phase. This interocular phase difference implied that the left- and right-eye responses were elicted by oscilltory grating motion in opposite directions. The responses from an adult with a history of infantile esotropia (EB6772, polar plots on the right in C) were like the responses from an infant, implying that (s)he retained the leftEye-rightEye motion asymmetry of a normal infant.
Rayleigh Discriminations in Young Human Infants (1981) Download
Spatial Summation in Dark-Adapted Human Infants (1983) Download
Absolute Thresholds in Human Infants Exposed to Continuous Illumination (1984) Download
High Visual Contrast Sensitivity in the Young Human Infant (1988) Download
Measurement of Spatial Contrast Sensitivity with the Swept Contrast VEP (1988) Download
The Development of Monocular and Binocular VEP Acuity (1988) Download
Polaroid Photorefractive Screening of Infants (1989) Download
Development of Contrast Sensitivity in the Human Infant (1990) Download
The Effect of Light Adaptation on Scotopic Spatial Summation in 10-Week-old Infants (1991) Download
Preoperative Alternate Occlusion Decreases Motion Processing Abnormalities in Infantile Esotropia (1994) Download
The Development of Motion Sensitivity During the First Year of Life (1994) Download
The Jitter Spatial Frequency Sweep VEP: A new paradigm to study spatiotemporal development of pattern- and motion processing mechanisms in human infants (2009) Download
The Visual World of Infants (2016) Download